
Some notes make more sense as a picture. A refund policy is easier to follow as a flowchart, a renovation as a timeline, a hard choice as a decision tree. Diagram turns a note into one of those: pick it from the apps menu and Grape draws the note as any of thirty shapes, from flowcharts and timelines to org charts, plans and charts of your numbers.
You do not need to know how to draw, or how any of it works. On the Plus, Pro and Lifetime plans the AI reads the note, picks the shape that fits and draws it, like AI flashcards and quizzes, on Lifetime through your own API key. On every plan, Free and Sync included and signed out too, you can start from a ready-made example and change its words. This guide takes you through both, and if you have never written a line of Mermaid, the plain text behind every diagram, it teaches you that as well. You can also ask the chat to draw one, like draw the refund steps as a flowchart, or to change one.
For now a diagram sits in the note as a card that you open, the way a mind map or a slide deck does. The drawing itself shows when you open the card.
What a diagram is good for
Writing runs in one line, top to bottom. A diagram shows what a line of text cannot: a choice that splits in two, steps that happen at the same time, who passes what to whom, how big one thing is next to another. Reach for one when you catch yourself rereading a paragraph to work out what happens next.
If you have used Mind Map, here is how the two differ. A mind map is always the same shape: one idea in the middle and everything it holds on branches, an outline you can see. Use it to see what a note is made of. A diagram can be thirty shapes, with arrows, dates, lanes and numbers, and it shows how the things in a note relate: what leads to what, what comes first, what overlaps. A meeting's topics make a good mind map. The process that meeting agreed on makes a good flowchart. And when the point is to walk a room through a note rather than to see its shape, that is a slide deck.
Adding a diagram to a note
Open the note and put the cursor where the card should go.
- Slash menu, on desktop. Type
/on an empty line, thendiagramif you like, and choose Diagram. - Toolbar, on desktop. Open Apps in the toolbar and choose Diagram, right after Mind Map.
- Apps menu, on mobile. Tap the apps button, the four squares, in the bar at the bottom of the note or on the toolbar above the keyboard, and choose Diagram.
A cyan card lands in the note. Click or tap it to open it. A note can hold as many of them as you want. If you never use Diagram, you can take it out of your menus.
Letting the AI choose with Best fit
On Plus, Pro and Lifetime the card opens on a short setup with one row, Template, which says Best fit. If you do not want to choose anything, leave it there and choose Create diagram.
Best fit goes by what the note holds, not what it is about. A note about a holiday can be a timeline if it lists what happens when, a pie if it splits a budget, or a kanban if it sorts the jobs left to do. Roughly:
- Steps with decisions along the way become a flowchart
- A choice worked out by answering questions in turn becomes a decision tree
- Events in order become a timeline, and dated events over years a history
- Work with start dates and lengths becomes a Gantt
- Tasks sorted by where they stand become a kanban
- People or teams and who reports to whom become an org chart
- Numbers that add up to a whole become a pie, and numbers that change become a chart
- When nothing else fits, a topic and its details become a mind map
The AI reads the note and the PDFs in it, and uses only what they say. It writes the labels in the language of the note, keeps them short and leaves out what does not matter, up to about thirty boxes. A note with nothing in it yet gets a message asking you to write something first.
You can close the dialog or the sheet while it draws. The card says Working on diagram until it is ready, and Grape tells you when it is, see Get notified when the AI is done. On desktop, Cancel in the dialog stops it. Each diagram the AI writes counts towards your AI usage.
Grape checks what the AI wrote the first time it opens. If it does not draw, the AI gets one chance to repair it by itself, before you ever see the problem.
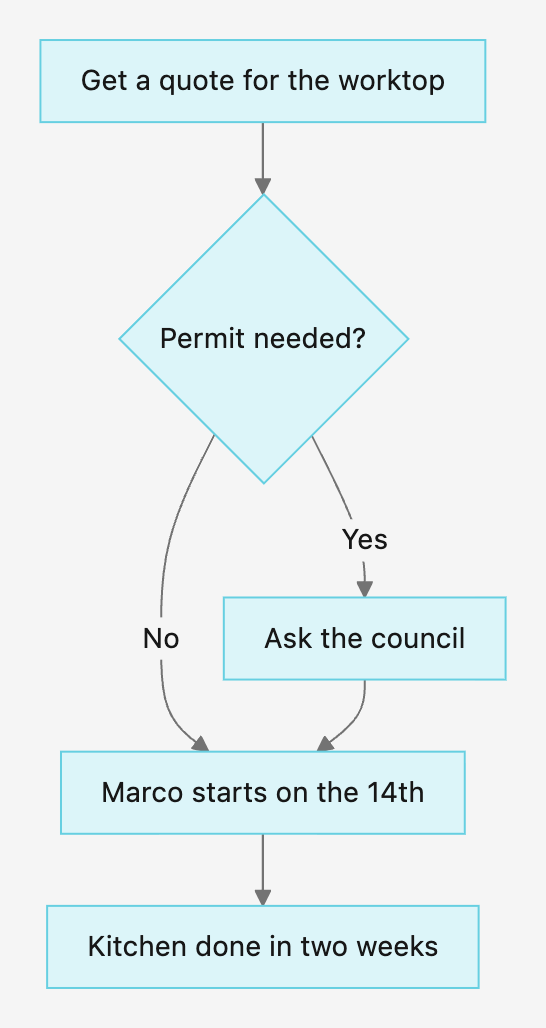
Picking a template yourself
If you already know you want a SWOT or a Gantt, say so. On the setup, open the Template row. A page opens in the same dialog or sheet with Best fit on top and all thirty templates under it, in six groups, each with its name, one line and a picture.
The pictures are examples, the same ones for everybody, because drawing your note thirty times would take thirty AI calls. Yours is drawn from your note. A tap picks a template and goes straight back, with its name on the row, and Create diagram draws the note that way. Change your mind with the back arrow, or by opening the row again and picking Best fit.
The next six sections go through all thirty, so you know what to reach for.
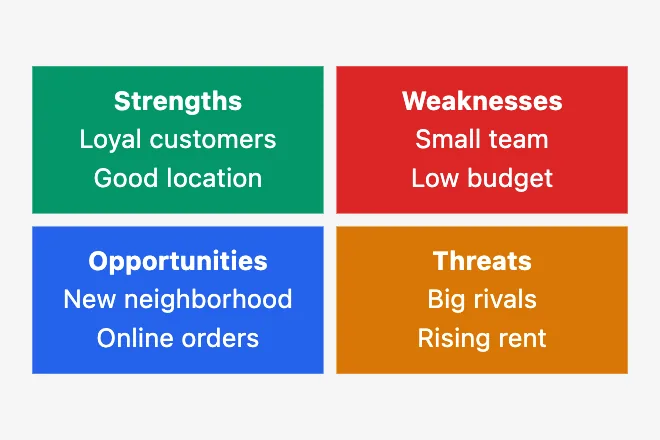
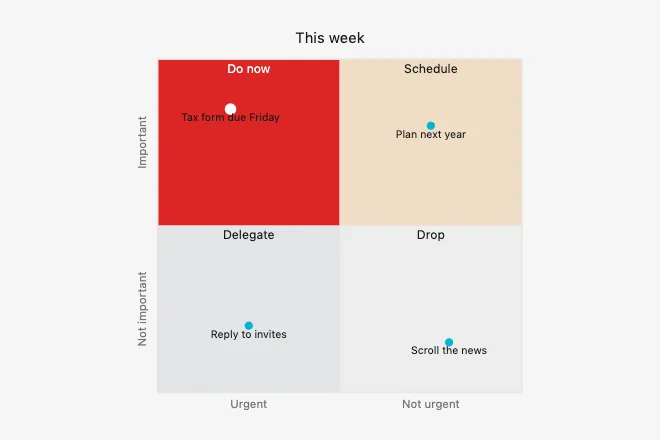
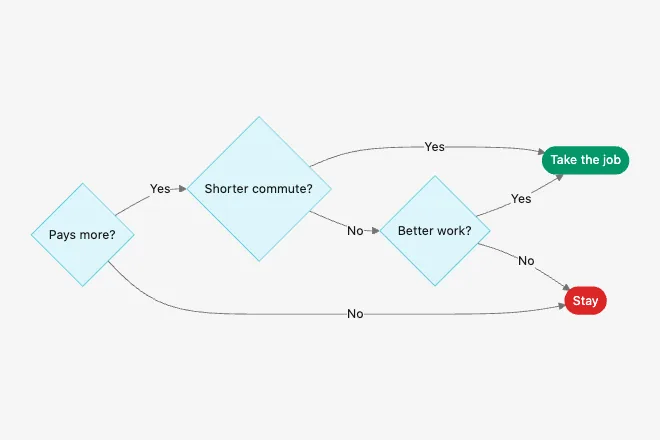
Common uses
The ones people look for by name. Each is laid out for its job.
- SWOT. Four boxes for strengths, weaknesses, opportunities and threats. Reach for it when weighing up a business, a job move or any plan with a downside.
- Urgent vs important. Tasks placed on a grid that splits them into Do now, Schedule, Delegate and Drop. Reach for it when a to-do list has stopped telling you where to start.
- Decision tree. A choice made by answering questions in turn, each answer leading to the next question or to an outcome. Good for yes or no choices like taking a job, or for a rule you keep having to explain.
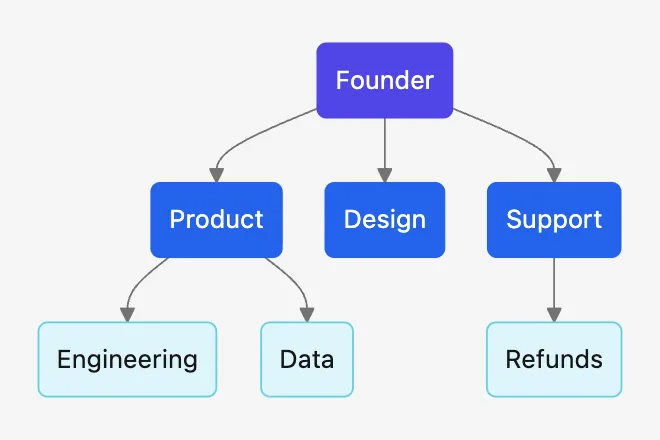
- Org chart. People or teams, and who reports to whom. Use it for a company, a club or a team that keeps changing.
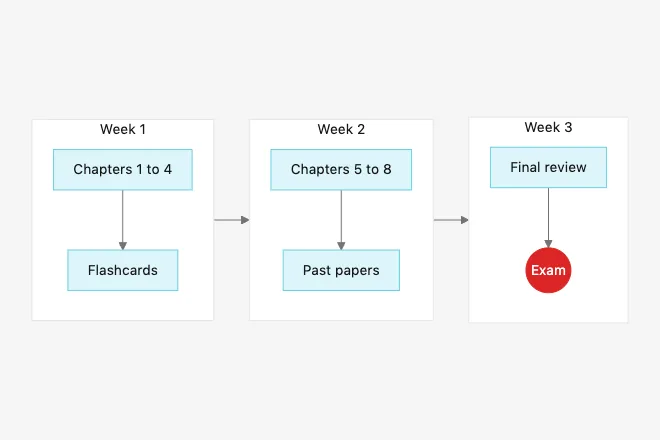
- Study plan. A board of weeks up to an exam, with what to study in each. Use it when a deadline is weeks away and the work needs dividing up.
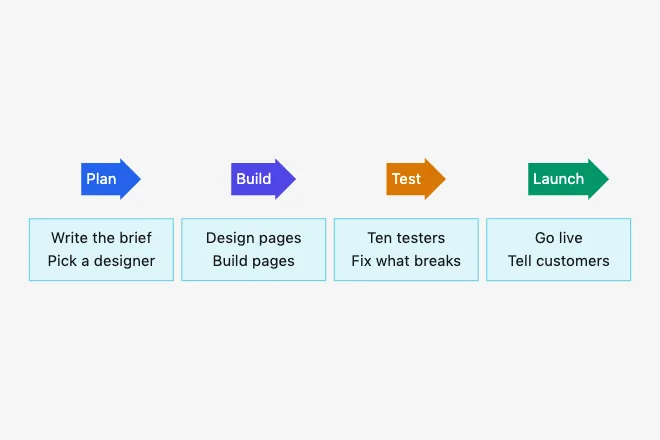
- Project plan. The stages of a project as arrows, with the tasks under each one, and no dates. Reach for it to show the shape of the work. When the dates matter, use a Gantt.
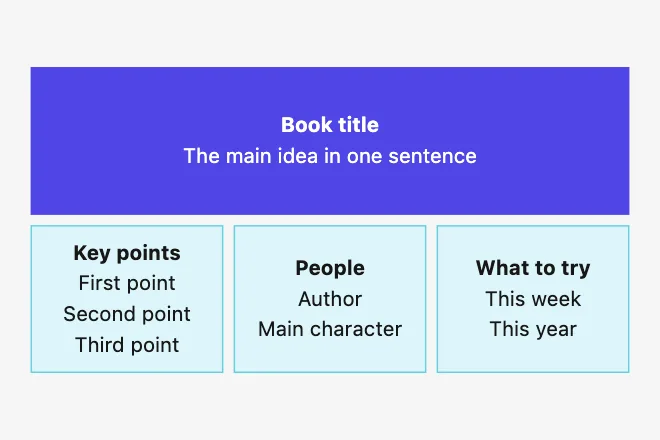
- Book summary. The title and main idea on top, then key points, people and what to try. Made for the end of a book, a talk or a long article.
- History of a topic. Dated events over years, read from top to bottom. Pick it when the dates are real and the order is the point.
Steps and flows
For things that happen one after another.
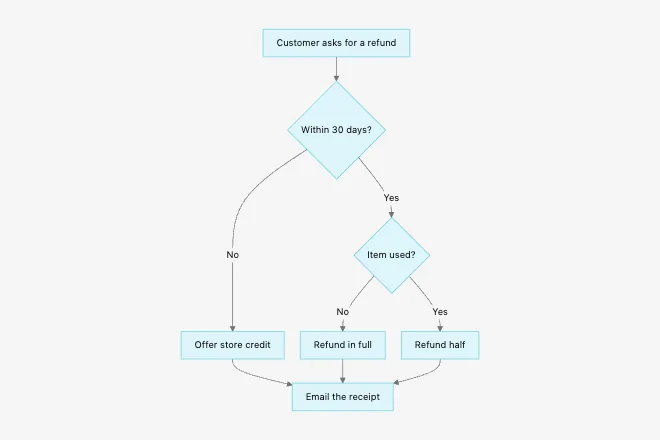
- Flowchart. Steps with decisions along the way. Reach for it for any process with an if in it: what to do when a customer asks for a refund, or how a form gets approved.
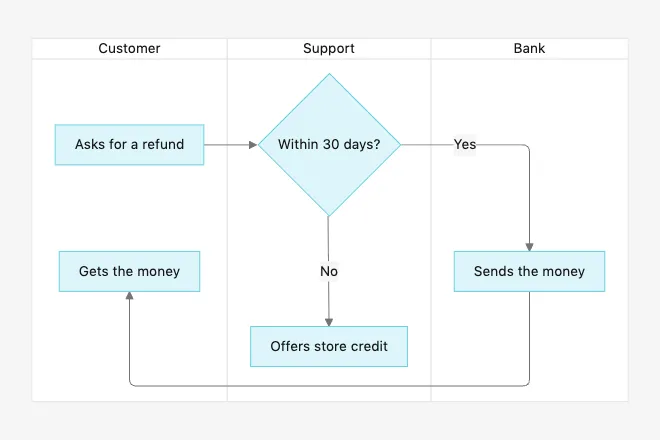
- Swimlane. A flowchart with a lane for each person or team. Pick it when it matters who does each step, and when work keeps getting stuck between people.
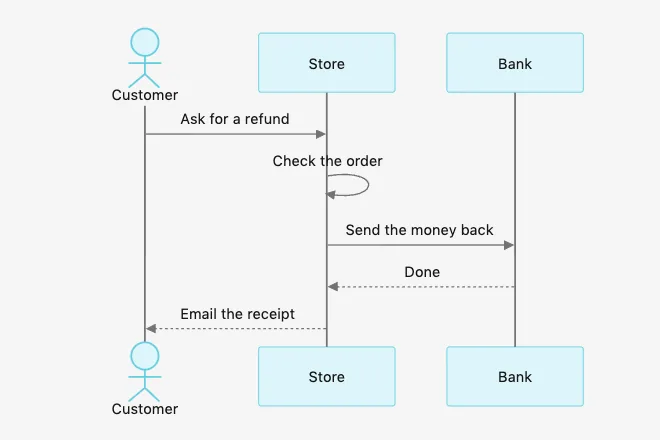
- Sequence. People or systems passing things back and forth, in order, with time running down the page. Good for a conversation or a handover.
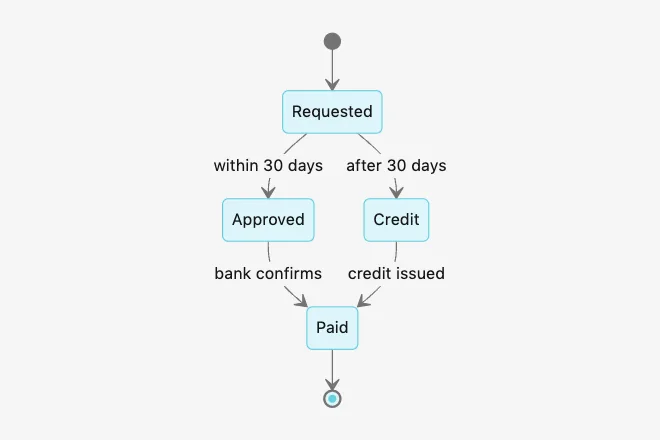
- State. One thing moving between named states, like an order going from requested to approved to paid. Use it when you care what a thing can become rather than who does what.
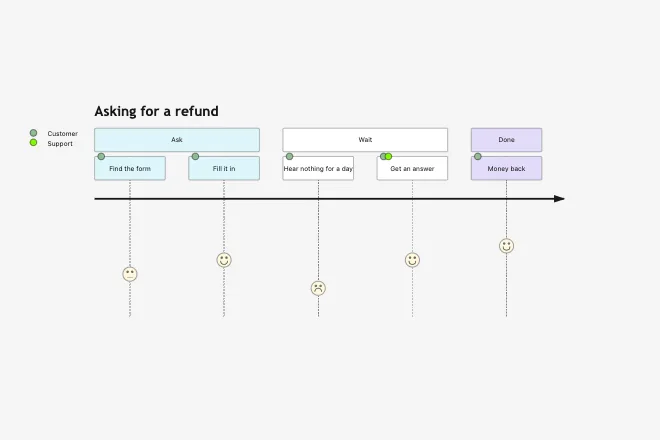
- Journey. How an experience felt, step by step, each step scored from one to five. Good for a customer's first week, or a trip you want to plan better next time.
Plans and time
For when the order or the dates are what you need to see.
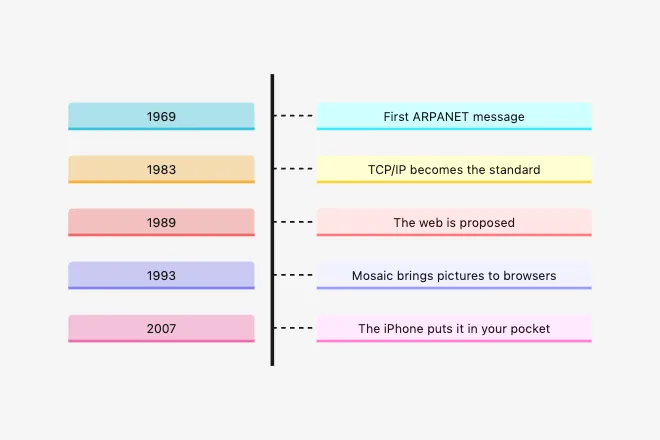
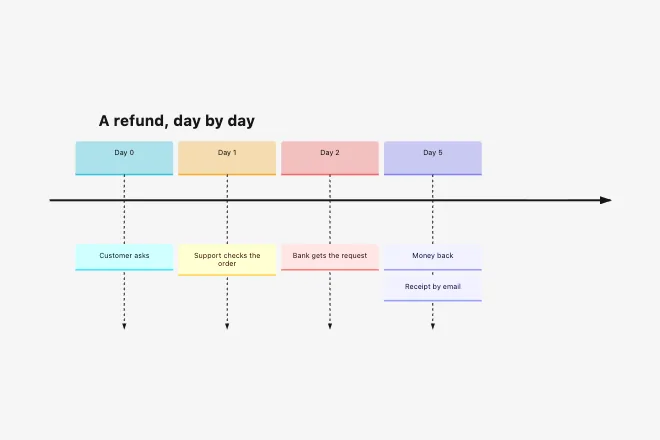
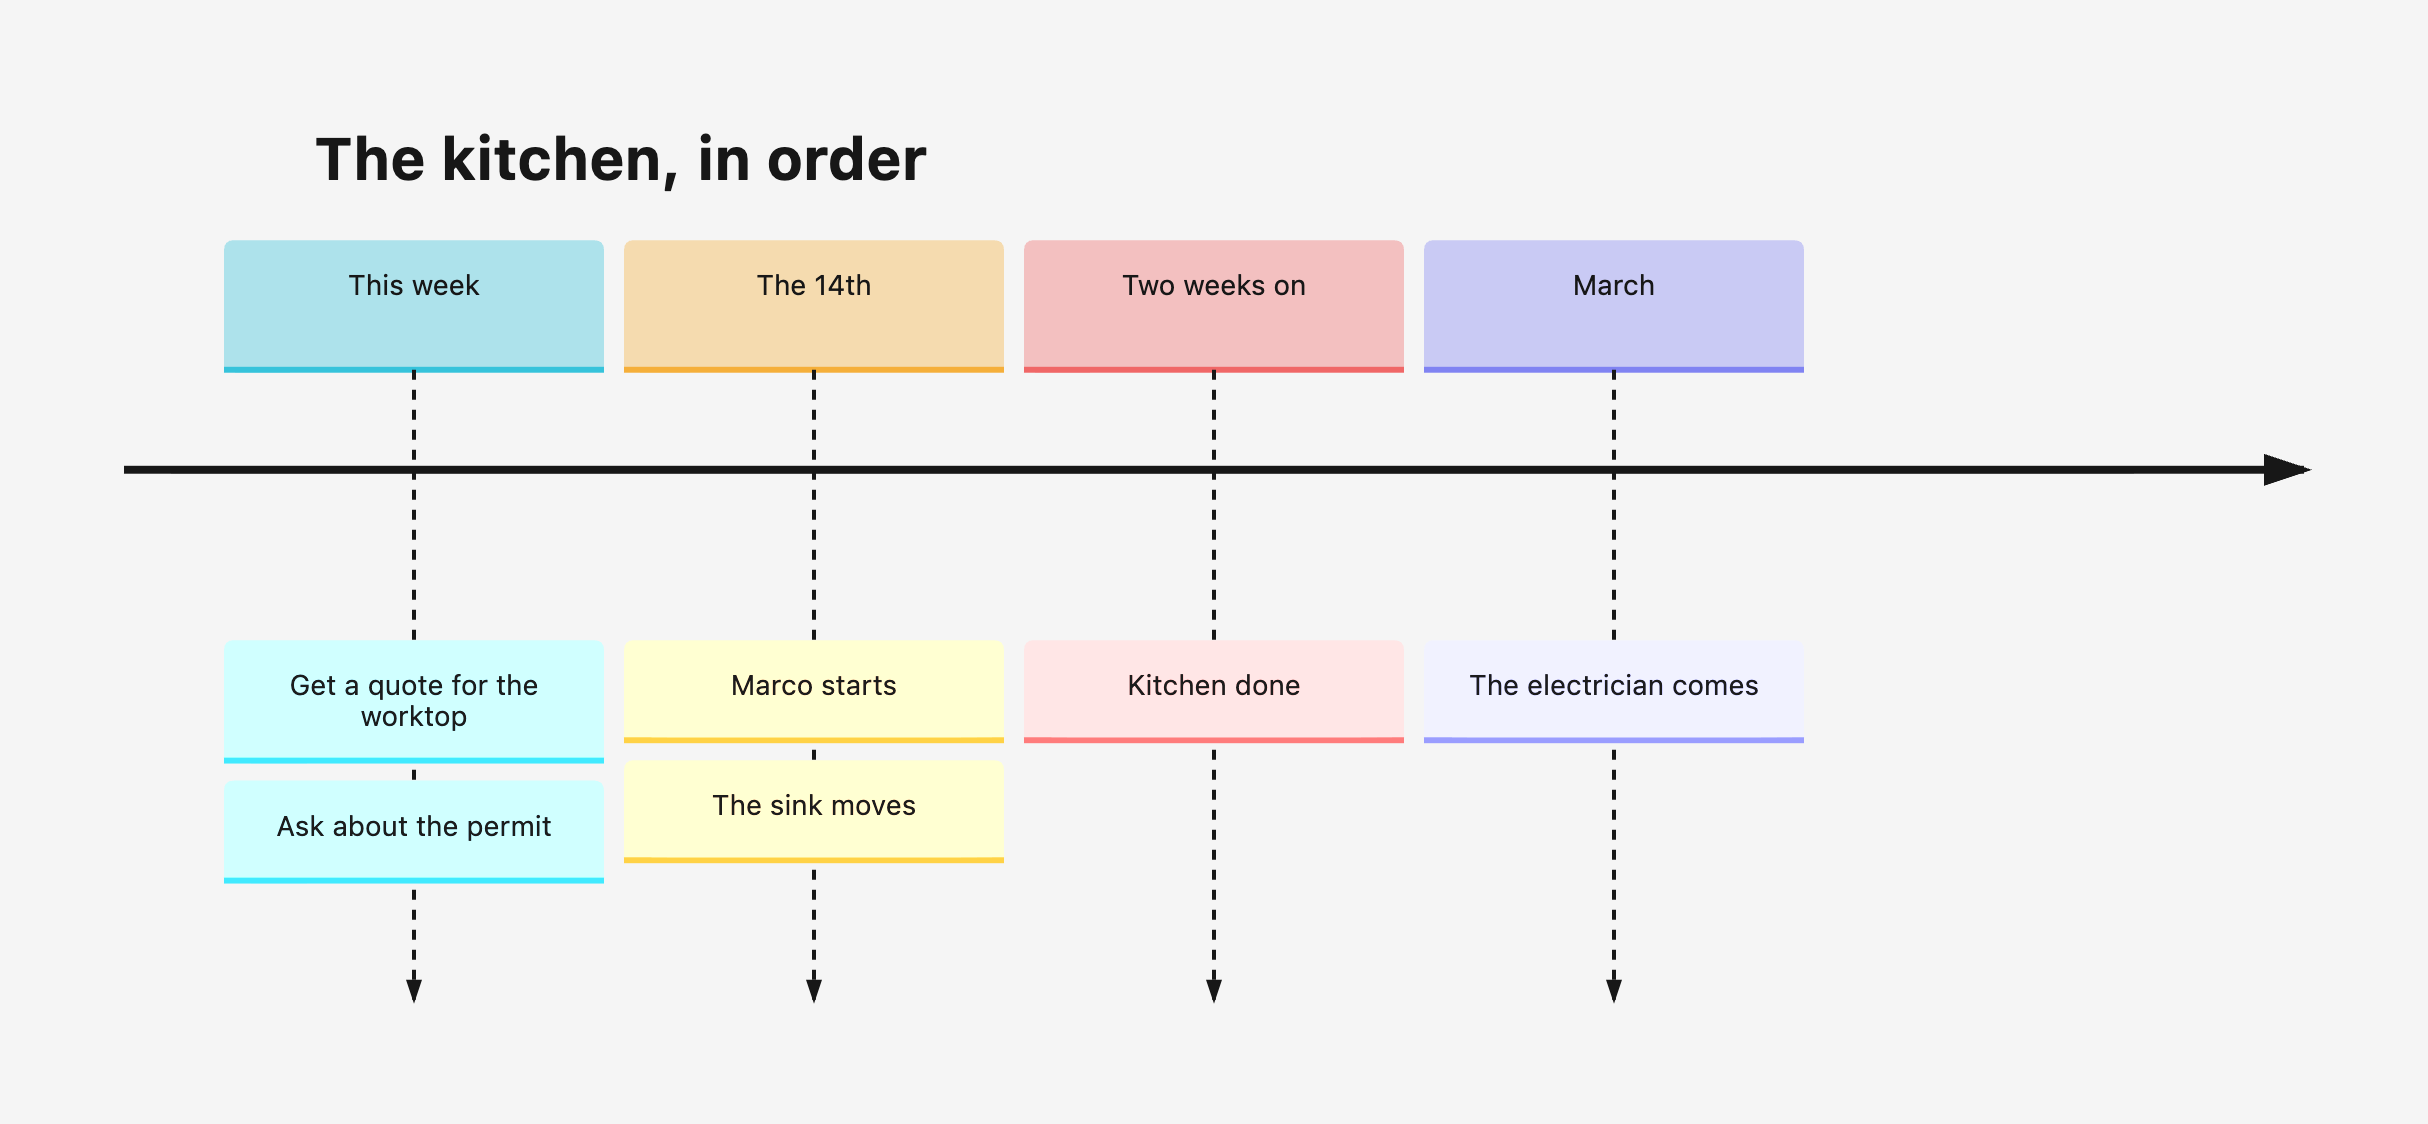
- Timeline. Events in order, without exact dates. Reach for it when "this week, then the 14th, then March" is as precise as you need.
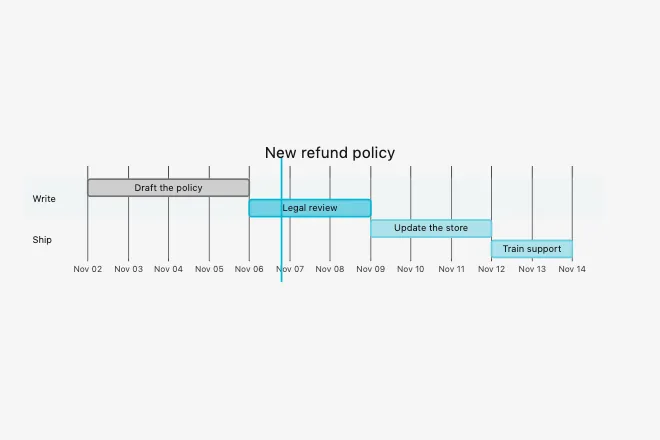
- Gantt. Work laid out over real dates, with bars for how long each part takes and which part waits for which. You want it when a late start pushes everything after it.
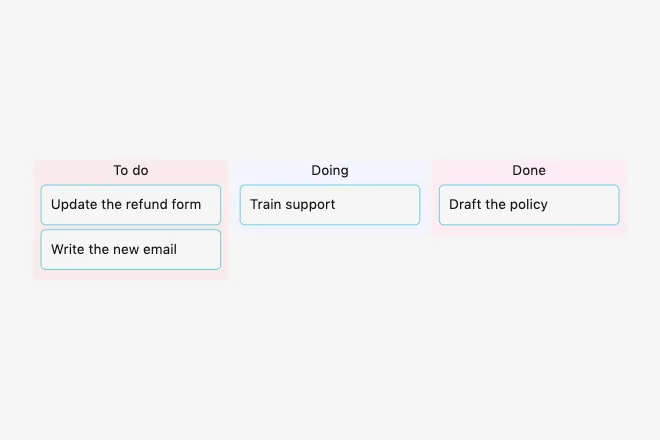
- Kanban. Tasks in columns by where they stand: to do, doing, done. It shows a pile of work at a glance. It is a drawing of the moment, so you move a task by changing the code. To drag tasks from column to column instead, add a board.
Ideas
For thinking something through.
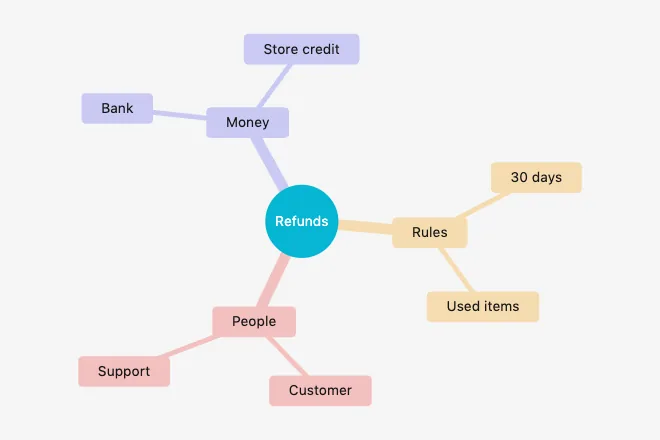
- Mind map. A topic and its parts, branching out. Reach for it when nothing else fits. For a map you can edit as an outline, the Mind Map app does more.
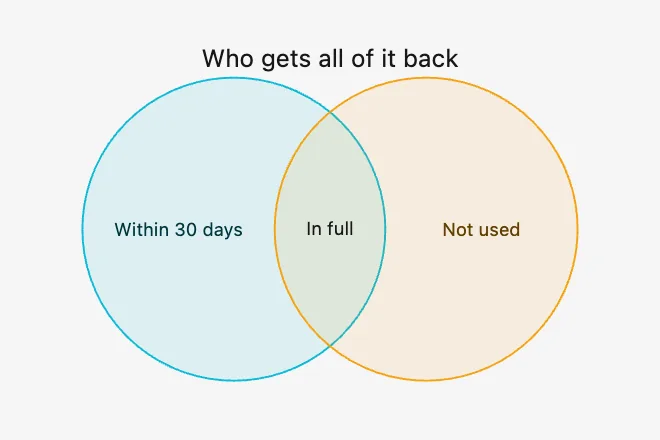
- Venn. Groups that overlap, and what they share. Use it to compare two or three things that have something in common.
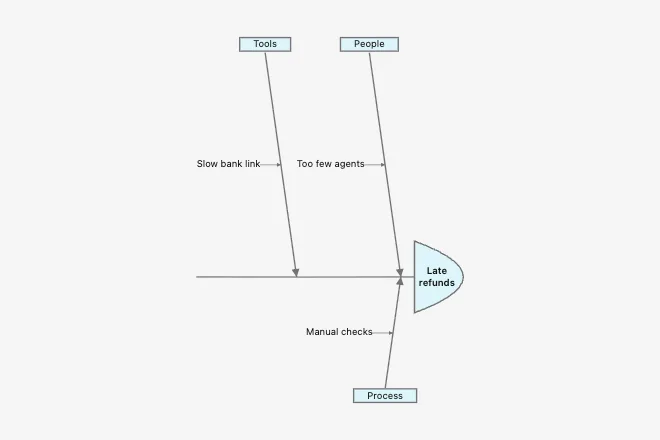
- Fishbone. A problem at the head, with its causes on the bones, sorted by kind. Pick it when something keeps going wrong and you want the reasons laid out rather than the first one you thought of.
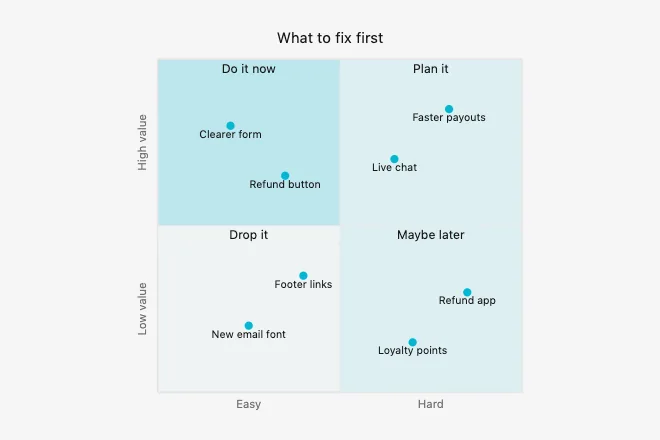
- Quadrant. Options placed on a grid by two measures you name, like how easy and how valuable. Good when a list needs sorting and one measure is not enough.
Numbers
For a note with figures in it.
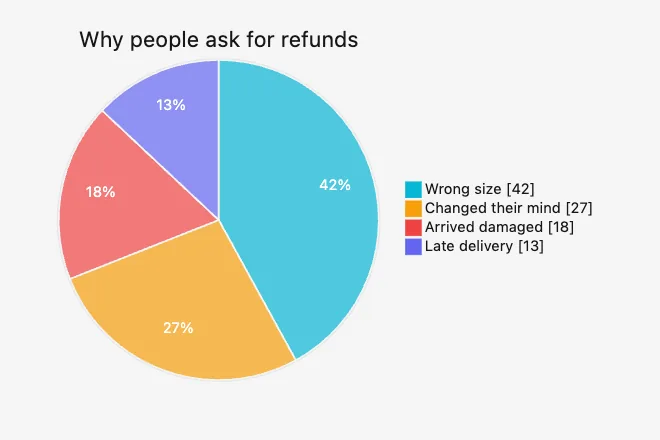
- Pie. Parts of a whole. Good for a budget, or where the time went, when there are only a few slices.
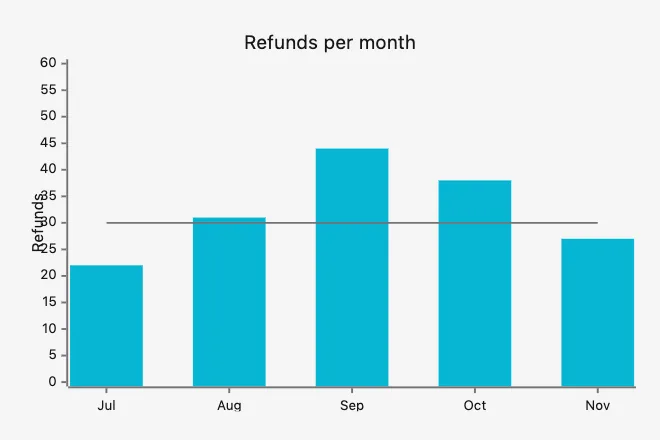
- Chart. Bars and a line across months or categories. Use it when numbers change over time or you are comparing groups.
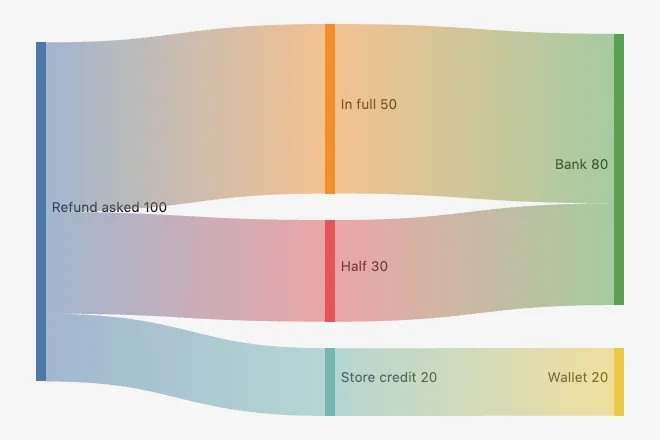
- Sankey. Amounts flowing from where they start to where they end up, with bands as thick as the amount. It shows where money or people go.
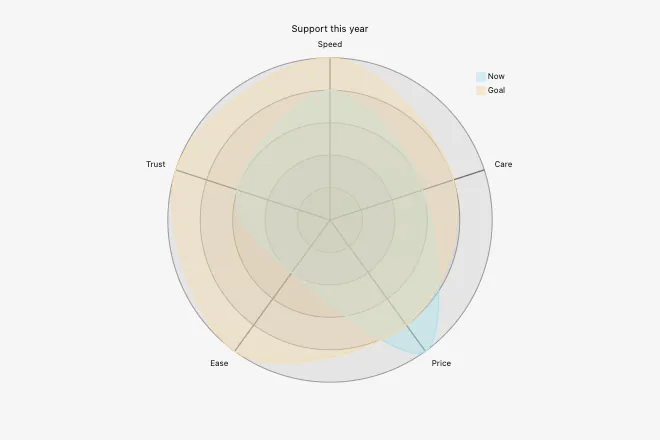
- Radar. Things compared on several scores at once, as shapes on a web. Made for two options scored on five measures.
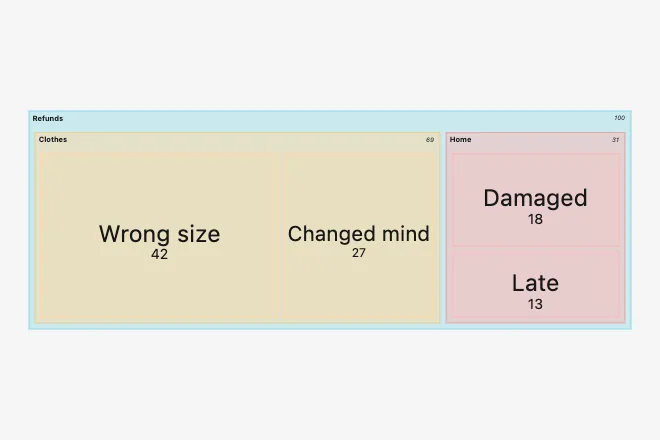
- Treemap. Sizes inside bigger groups, as boxes in boxes. Pick it when a pie would have too many slices and they fall into groups.
Systems
For how something is built. You will not need these for most notes, and they are there when you do.
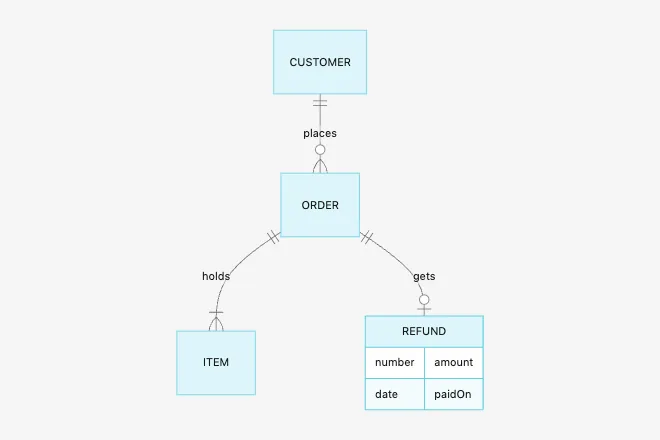
- Entities. Kinds of data and how they link: customers place orders, orders hold items. Use it to plan a database or a spreadsheet that has outgrown itself.
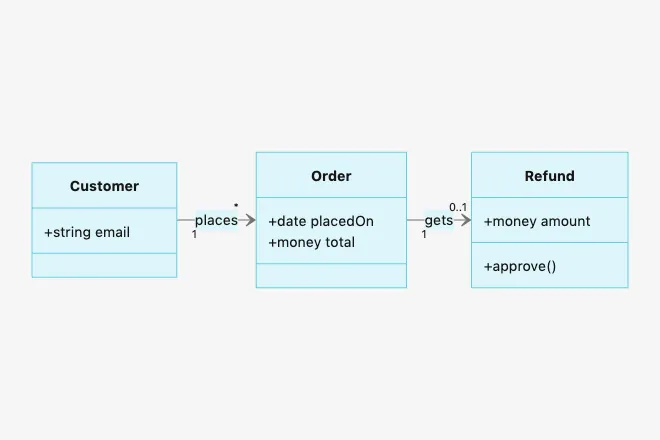
- Class. Kinds of things with their parts and how they relate. For describing how a program is put together.
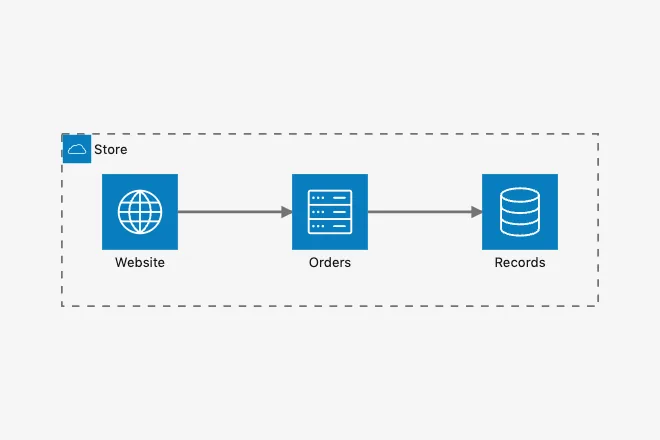
- Architecture. The parts of a system and how they connect, like a website, a server and a database. It explains a setup to someone new.
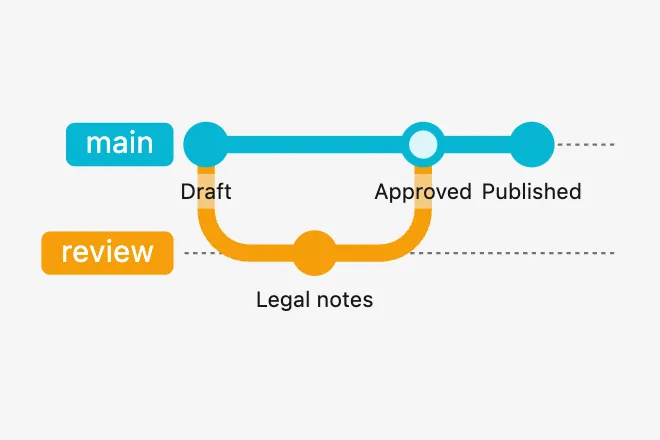
- Git graph. Versions, branches and merges. It shows how drafts split off and came back together.
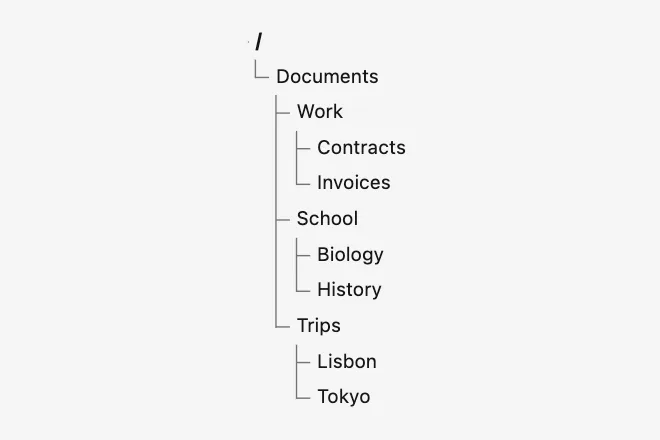
- Folder tree. Files and folders, nested. Use it to plan how a shared drive or a project should be set out.
Changing to another template
Under a drawing the AI made, you get a row of templates: the one in use, filled in, then up to three others the AI said would suit this note, two on the phone, and More, which lists all thirty.
Tap one and the note is drawn that way. The drawing stays up, dimmed, until the new one is back. That is one more AI call and counts towards your AI usage.
A template you already tried comes back at once, for free, with no AI call. Grape keeps the last six you tried on that card, so you can go back and forth while you decide.
The row goes away once you edit the code yourself, so a tap can never overwrite your work. Those saved tries go with it.
Writing one by hand
On every plan you can skip the AI. On Plus, Pro and Lifetime, choose Create by hand beside Create diagram, under it on the phone. On Free and Sync it is the main button on the card, with a small Let AI make it from your note link under it that says what the Plus and Pro plans add.
Pick a template opens, with the same thirty pictures. Tap one and its working code opens, ready to change. If you already picked a template on the setup, Create by hand opens that one's code straight away.
Almost nobody writes this from memory, and you do not have to. The fastest way in is to keep the template's shape and change its words: replace Customer asks for a refund with your own first step, and watch the drawing follow. Templates are written in English, whatever language your app is in. Your own words can be in any language.
- On desktop the code stands in a box with line numbers, beside the drawing, which redraws a moment after you stop typing.
- On mobile Code and Diagram take turns, since there is no room for both with the keyboard up. A row over the keyboard holds what is slow to type on a phone:
-->,---,-- text -->,[ ],( ),{ },|,:,"and%%.
Choose Save when you are done, the tick at the top of the sheet on mobile. Cancel takes you back without keeping the change. To open it again later, open the card and choose the pencil. That works on every plan and on a diagram the AI wrote too. A diagram can be up to 20,000 characters long, far more than a drawing anyone could read.
Start blank, at the foot of Pick a template, opens an empty box, for pasting your own.
What Mermaid is
The code behind every diagram is Mermaid, a free and popular way of writing diagrams as plain text. You say what is there and what connects to what, and it works out the layout, so moving a box means changing a word rather than dragging lines around. GitHub, Notion and Obsidian understand it too, so anything you write here is yours to use elsewhere.
The next sections are a short course, enough to read any diagram and change it with confidence. Each example draws exactly as you see it, so you can copy it into a card and try it. Grape draws with Mermaid version 11, and the box takes any diagram it can draw, not only the thirty templates. Mermaid's own documentation has the rest. It still calls some of these beta (Swimlane, Folder tree, Chart, Sankey, Radar, Treemap, Venn, Fishbone and Architecture), so their code could change when Grape moves to a newer Mermaid.
Your first flowchart
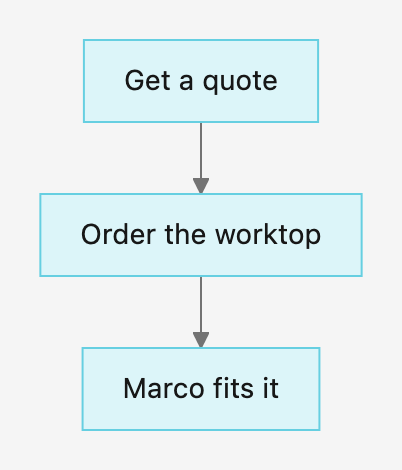
Three steps in three lines:
flowchart TD
  A[Get a quote] --> B[Order the worktop]
  B --> C[Marco fits it]
- The first line names the kind of diagram. Every diagram starts this way, and it is the one line Mermaid cannot do without.
A[Get a quote]is a box.Ais its short name, which is never drawn, and the words in the brackets are what you see.-->is an arrow.- Once a box has words, its short name is enough. The second line says
B, not the whole box again.
The spaces at the start of a line are only there for you. Short names can be anything without spaces, like A or quote.
Arrows and labels
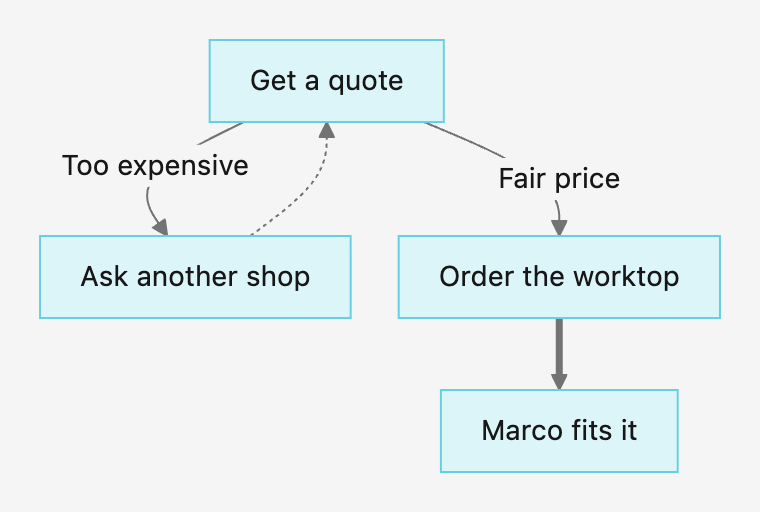
The line between two boxes can say more than an arrow:
-->is an arrow---is a plain line-.->is a dotted arrow, good for "maybe" or "later"==>is a thick arrow, good for the main path-- Yes -->is an arrow with words on it
flowchart TD
  A[Get a quote] -- Too expensive --> B[Ask another shop]
  A -- Fair price --> C[Order the worktop]
  B -.-> A
  C ==> D[Marco fits it]
A -->|Fair price| C means the same as A -- Fair price --> C. You will see both in code other people write.
Box shapes
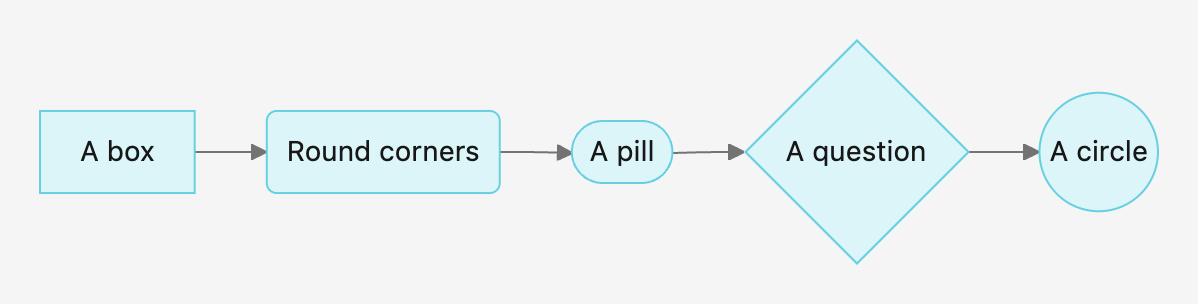
The brackets round the words choose the shape:
flowchart LR
  A[A box] --> B(Round corners)
  B --> C([A pill])
  C --> D{A question}
  D --> E((A circle))
By custom a diamond asks a question and has two arrows leaving it, and a pill starts or ends something. Nothing forces you to follow that, but people reading your diagram will expect it.
Direction
The two letters after flowchart say which way it runs:
TDtop to bottomLRleft to rightBTbottom to topRLright to left
Change one word and the whole drawing turns. You can also chain arrows on one line:
flowchart LR
  A[Monday] --> B[Tuesday] --> C[Wednesday]
Top to bottom usually reads better on a phone, and left to right on a laptop.

A sequence
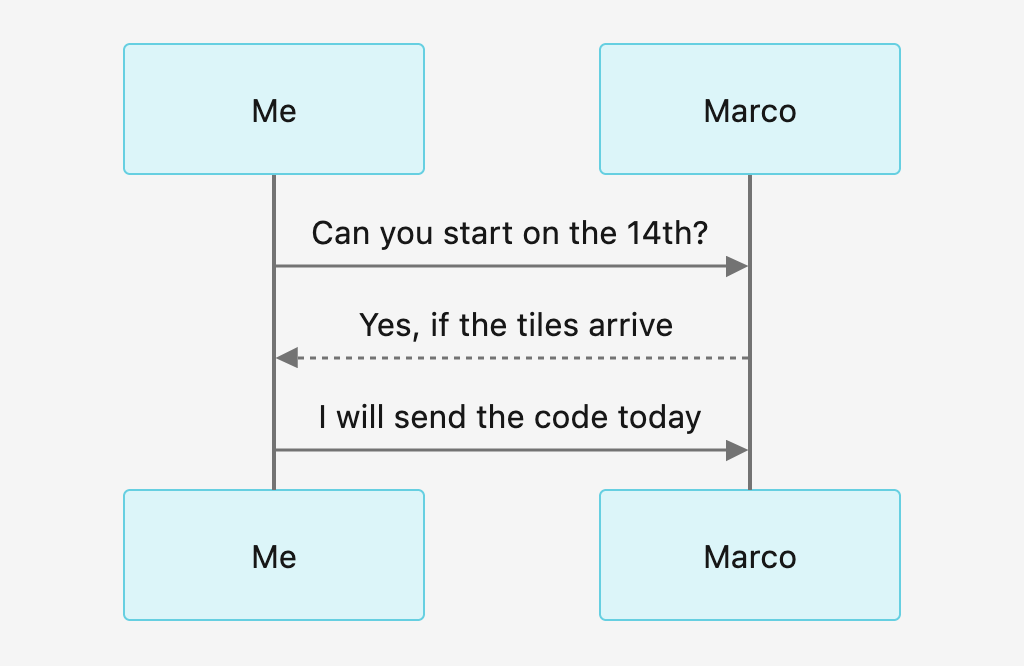
For people passing things back and forth, each one gets a column and time runs down the page:
sequenceDiagram
  participant Me
  participant Marco
  Me->>Marco: Can you start on the 14th?
  Marco-->>Me: Yes, if the tiles arrive
  Me->>Marco: I will send the code today
participant names a column, and the order you name them in is the order they stand in. ->> is a solid arrow, usually a request, and -->> a dashed one, usually the answer. What comes after the colon is written on the arrow.
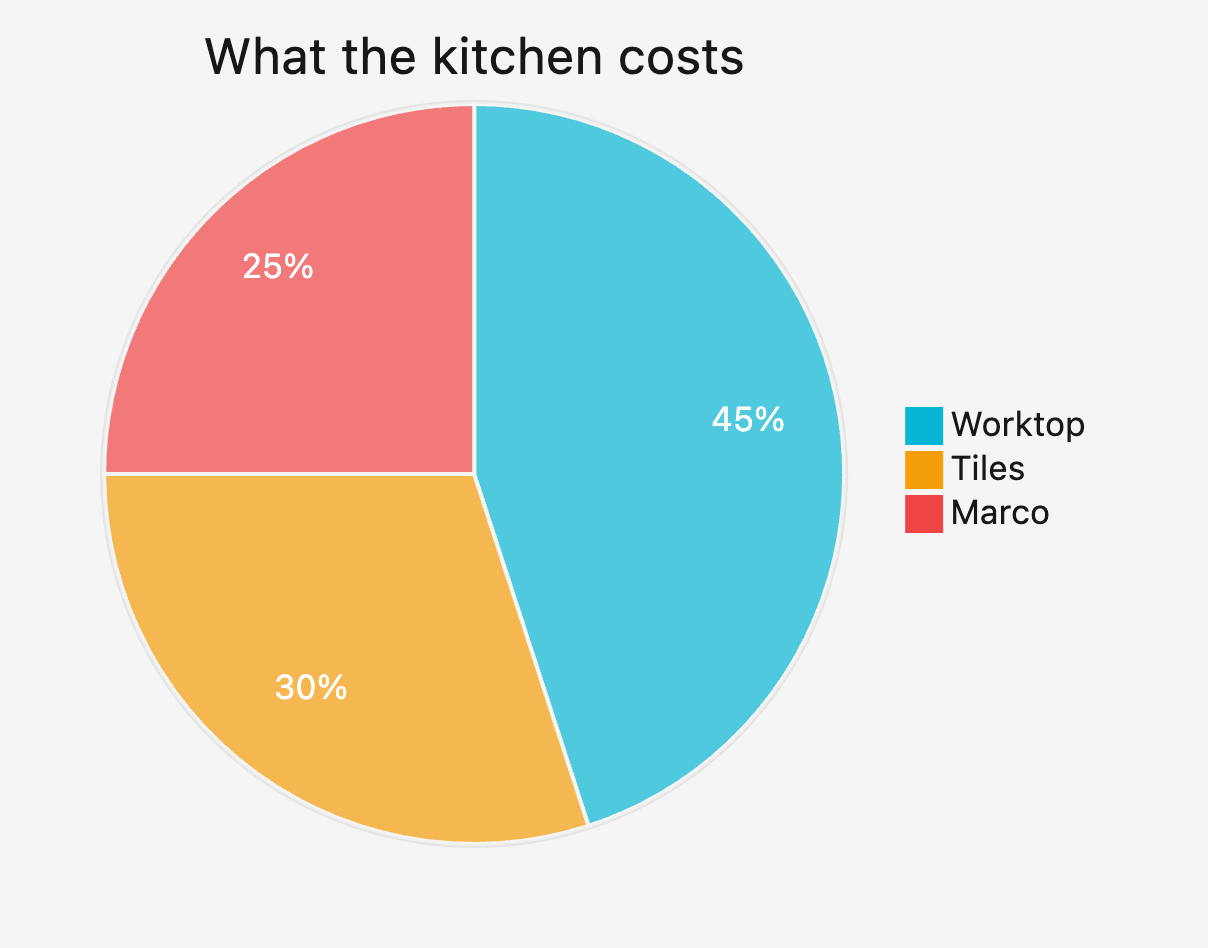
A pie
A title, then a line for each slice:
pie
  title What the kitchen costs
  "Worktop" : 45
  "Tiles" : 30
  "Marco" : 25
The words go in double quotes. The numbers can be anything, not only percentages: Mermaid works out each slice's share of the total and writes it on the slice.
Comments
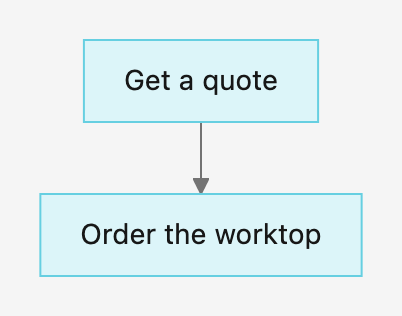
A line that starts with %% is a note to yourself. It stays in the code and is never drawn:
flowchart TD
  %% Ask Marco about this on Friday
  A[Get a quote] --> B[Order the worktop]
Pasting from ChatGPT or Claude
Any AI that knows Mermaid can write you a diagram, and that works on every plan in Grape. Ask for it by name, and paste your text:
Draw this as a Mermaid flowchart. Keep the labels short, and put any label with punctuation in double quotes.
Copy what it writes. In Grape, open the card, choose Create by hand and then Start blank, and paste it into the box. If the code comes with the three backticks chat apps put round it, Grape takes those off when you save. Then choose Save.
The same works the other way: Copy code on desktop, or the box itself on mobile, gives you code to paste into any AI and ask for changes.
If it does not draw, the next section says what to do.
When a line is wrong
Half written code is normal, so a wrong line never blanks the drawing. The last drawing that worked stays up, dimmed, and one line says where the trouble is.
- Mermaid got stuck near line 2 comes with the line in question, and on desktop that line's number turns red. It says near because a bracket left open is only noticed on the line after it, so look at the line above as well.
- The first line should name a diagram, like flowchart TD means just that: the code needs a first line like the ones in this guide.
- This does not read as Mermaid yet is what you see when Mermaid cannot say where. It usually means text that is not Mermaid at all got pasted in.
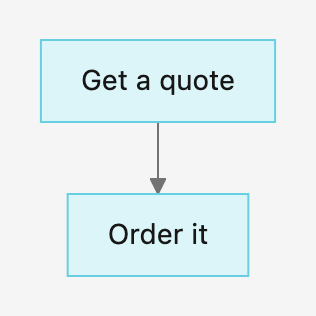
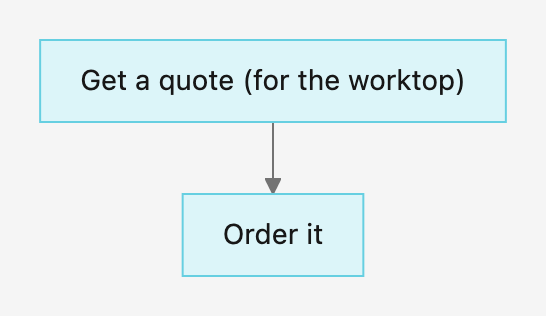
The mistake everyone makes first is parentheses in a label. Mermaid reads them as a shape, so this does not draw:
flowchart TD
  A[Get a quote (for the worktop)] --> B[Order it]
Double quotes round the words fix it:
flowchart TD
  A["Get a quote (for the worktop)"] --> B[Order it]
The same goes for a colon or other punctuation that gets stuck in a label. When in doubt, use quotes.
On Plus, Pro and Lifetime, Fix it stands next to the message. It asks the AI to repair the code, changing as little as it can and keeping your labels. It counts as one AI call, like any other, and you can still change the result by hand.
Save always works, even with a wrong line, because losing what you typed is worse than a broken diagram. The card then opens on the last good drawing, with the same message under it and Showing the last good drawing.
Moving around a diagram
A diagram opens fitted to the dialog or the sheet.
- Drag to move around it, on either device.
- Two fingers on a trackpad, up or down, or a mouse wheel zoom in and out on desktop, the same as Mind Map.
- Pinch to zoom, on a trackpad or on the phone's screen.
- The buttons in the corner, on desktop, zoom in, zoom out and fit it again, the same ones as Mind Map.
- Double click or double tap shows all of it.
A Gantt, a timeline or a journey fitted to a phone's width would be too small to read, so the phone opens those up close and you drag along them. A double tap still shows the whole thing.
Copying the code and saving a picture
On desktop, the buttons in the corner of the dialog do this: Copy code puts the Mermaid on your clipboard, and Save as picture saves the drawing as a PNG. On mobile, Share at the top of the sheet sends the picture through the system's own share sheet, to Messages, Mail or your photos. To copy the code on the phone, open the pencil and select it in the box.
The picture has the colors you see, with the words plain, so any bold in a label comes out as normal text.
Colors and themes
What Grape saves is the code, with nothing drawn, so a diagram takes its colors from your theme and accent color. Change either one and the drawing changes with it, dark themes included, and the same diagram opens in your own colors on your phone and in someone else's in a note you share.
A few templates keep their own colors, because they mean something: the four boxes of a SWOT or the red and green ends of a decision tree. That is all of Common uses except History of a topic. Those colors are written in the code, so they stay the same in every theme.
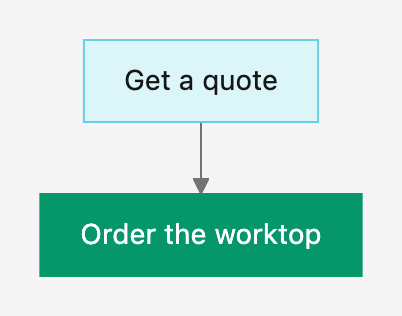
You can do the same to any box. Add a style line with its short name:
flowchart TD
  A[Get a quote] --> B[Order the worktop]
  style B fill:#059669,stroke:#059669,color:#fff
fill is the inside, stroke the edge and color the words, each as a hex color.
What each plan gets
On every plan, Free and Sync included, and signed out too, you can add a diagram, start from any of the thirty templates or a blank box, write and paste code, and draw, zoom, copy and save it. Editing works on every plan, on the AI's diagrams as well.
On Plus, Pro and Lifetime the AI can make it too: Best fit, picking a template for the AI to draw, the row of other templates under a drawing, and Fix it. Plus and Pro use Grape AI with no keys to manage, and Lifetime runs on your own API key. The AI work counts towards your AI usage on Plus and Pro.
On Free and Sync the card opens on Make your own diagram, with Create by hand as the main button and a quiet Let AI make it from your note link. If you turned AI off, that link goes too, and the by hand path is all you see.
Where a diagram lives
A diagram belongs to its note. It syncs across your devices, including through Dropbox and Google Drive, and goes along in backups and version history. In a shared note or folder everyone sees the diagram in their own theme, and whoever can edit the note can edit it.
Delete the card and the diagram goes with it. A note holding a diagram cannot be locked until you take it out, and there is nothing to answer in one, so it does not join Review.
Drawn on your device
Your device does the drawing. Mermaid comes with the app and runs on the device, with nothing sent anywhere, so a diagram opens and redraws with no internet, on every plan. The only time a note leaves your device for this is when you ask the AI to make a diagram or fix one, and then it goes to the model you use for AI.
A diagram never loads anything from the internet. It draws in a sealed page with no way out, so a picture or a link in someone's code does nothing: no web images, no tracking, no opened pages. That holds for a diagram in a note someone shared with you as well, and it cannot read anything else in your library.
The other tools
The same note can become a mind map to see its shape, a slide deck to present it, an infographic to hand it to someone who will not read it, or a story to watch it. To study it, make flashcards, a quiz or a fill in the blank exercise. To sketch something freehand, a drawing is quicker. Any of them you never use can leave your menus.